
mAsh
Visitor analytics tool for offline markets
About mAsh
mAsh displays visitor data from CCTV footage using AI video analysis technology.
mAsh's clients are franchise store headquarters.
They utilize visitor data through mAsh's dashboard to review and enhance their stores.
I designed and planned the dashboard as a solo designer.

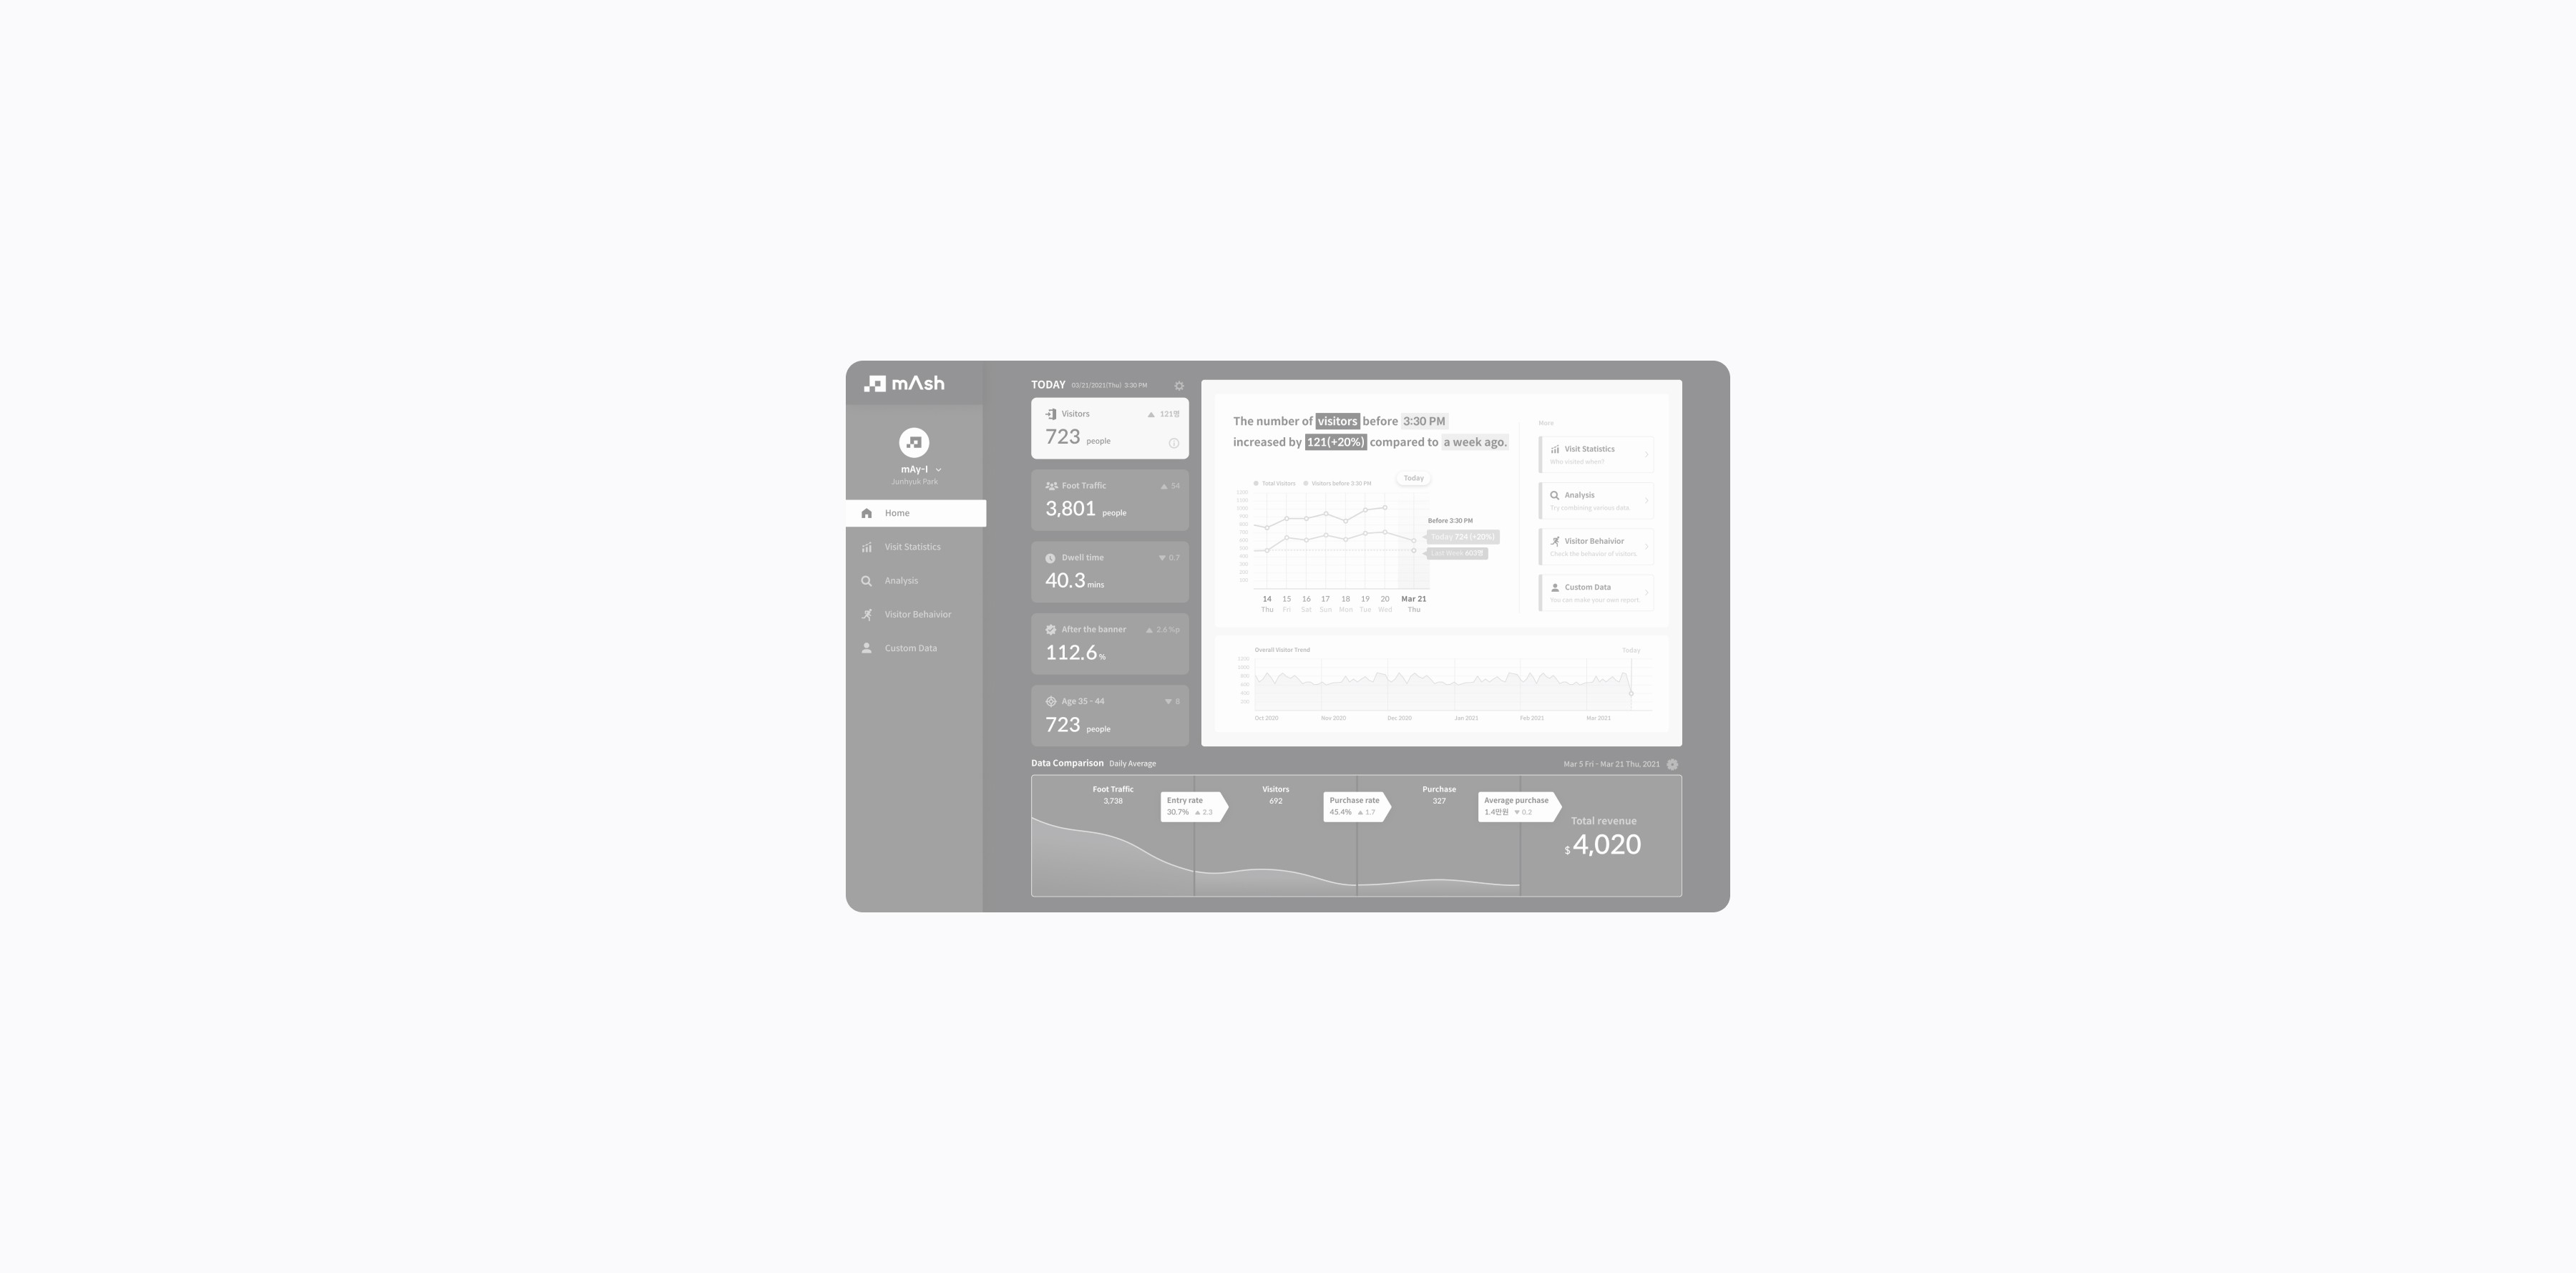
The Previous Version
At that time, I was the first product designer at the company.
The previous UI design was made with a template.

The state of the product when I first joined.
First Attempt
As soon as I joined the team, I designed a new version with improved usability, based on a new plan from a product manager.

…and Failure
However, there was no increase in customer engagement. In fact, it was almost zero.
I found the biggest problem:
Problem
Insufficient Understanding of Users
The product team lacks understanding of the users and the industry they work in.
Unclear Direction for a Product
As a product with few existing precedents, the direction of this business itself is still unclear.
Undefined Value Proposition
So, the value our product can provide to users is also not yet clearly defined.
Ultimately, the team's lack of understanding of both our customers and our product was the core issue.
Solution
I believed that to solidify the direction of the product, it was crucial to first enhance the team's understanding of the users.
Therefore, I directly contacted the client team and organized the first meeting between our product team and the customer.
Then I shared effective UX methodologies for user engagement with my team.
Given the early stage of the product, it was imperative for all team members to synchronize fully and share all relevant information and contexts.

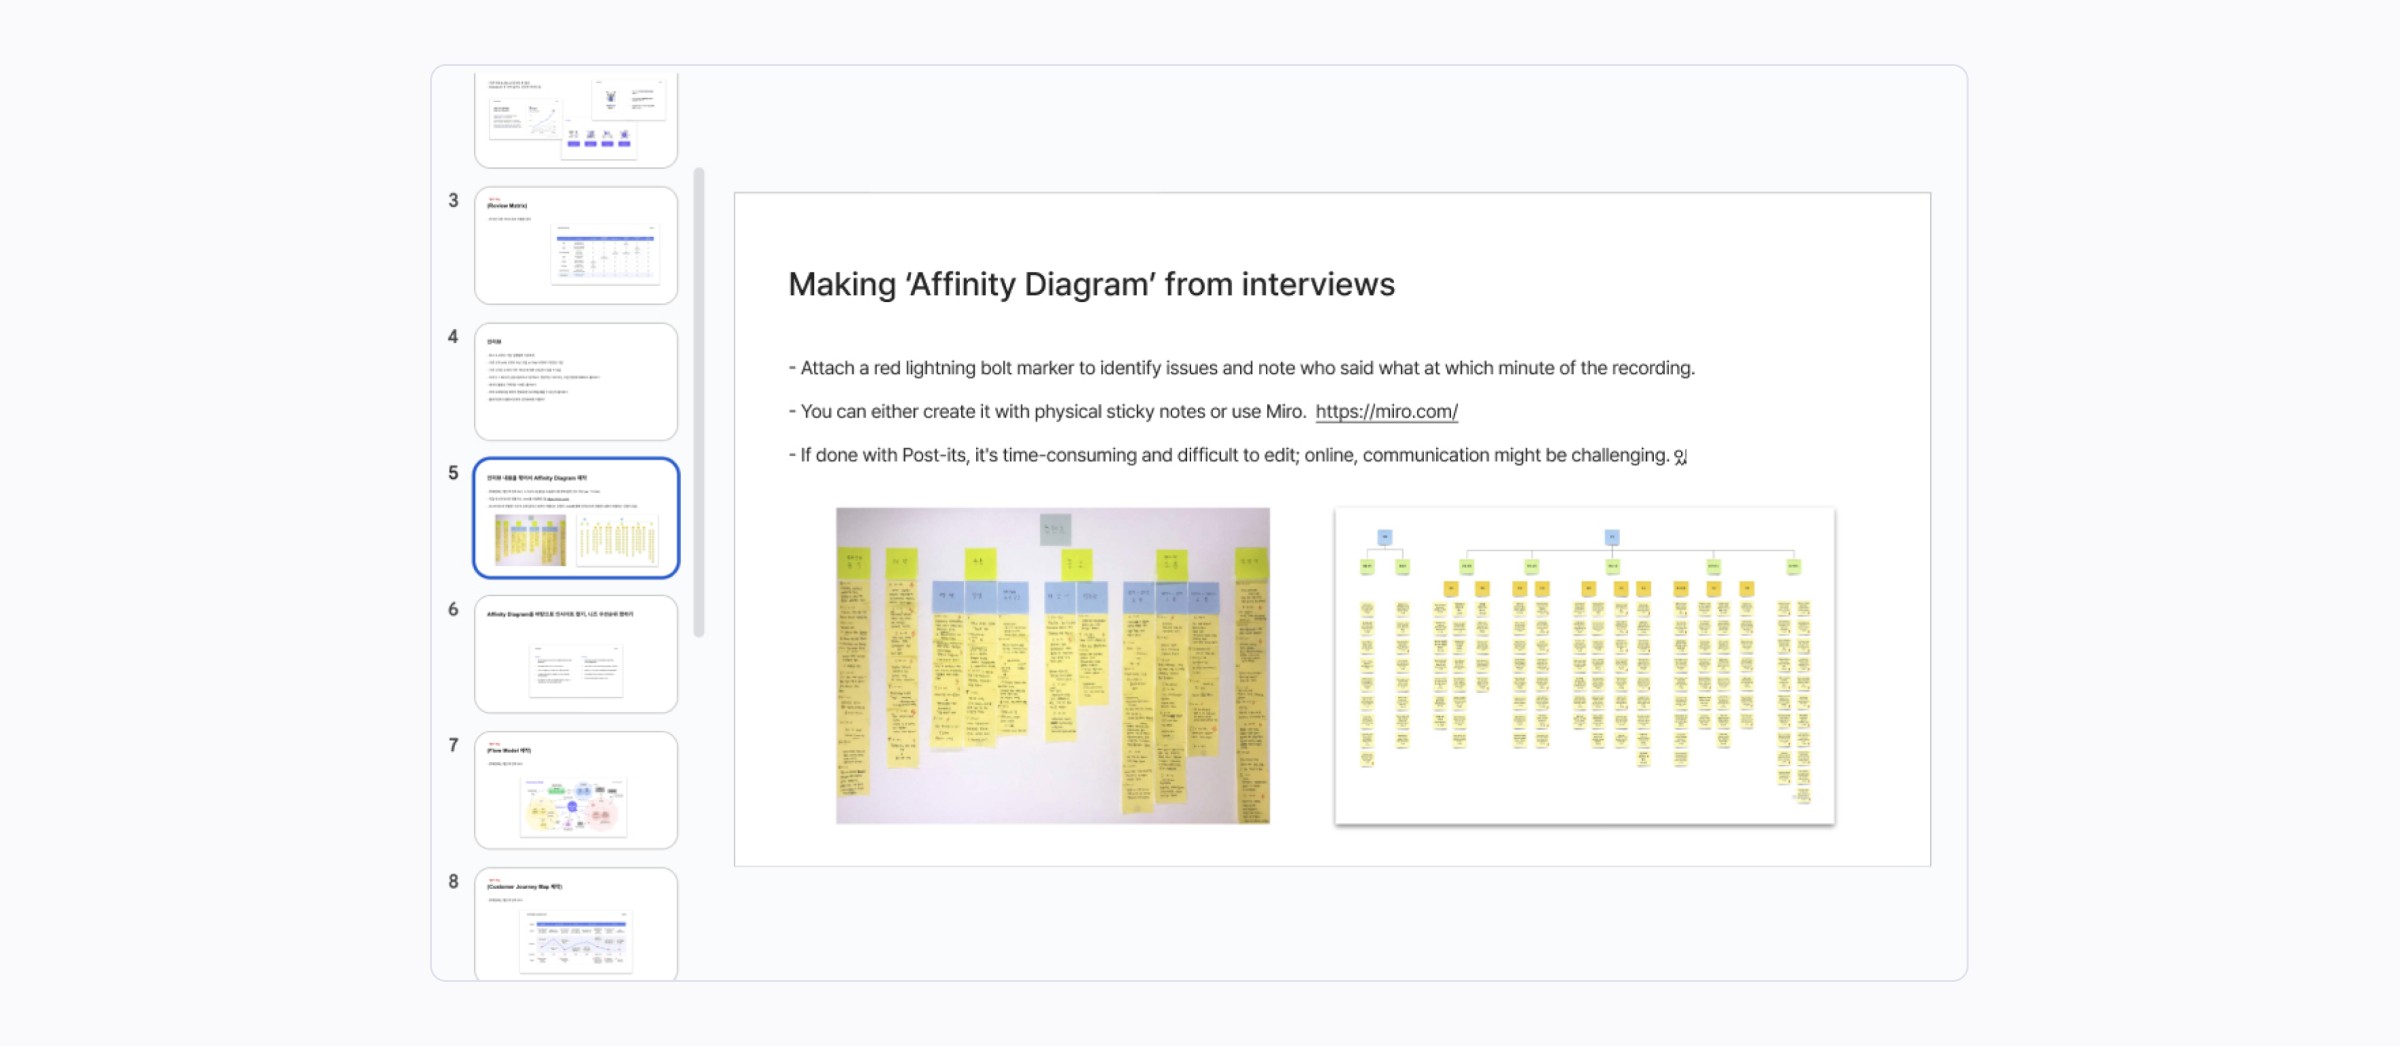
Storyboarding
I defined a persona based on user research findings and created storyboards.
This allowed team members to synchronize direction intuitively.

Usability Test

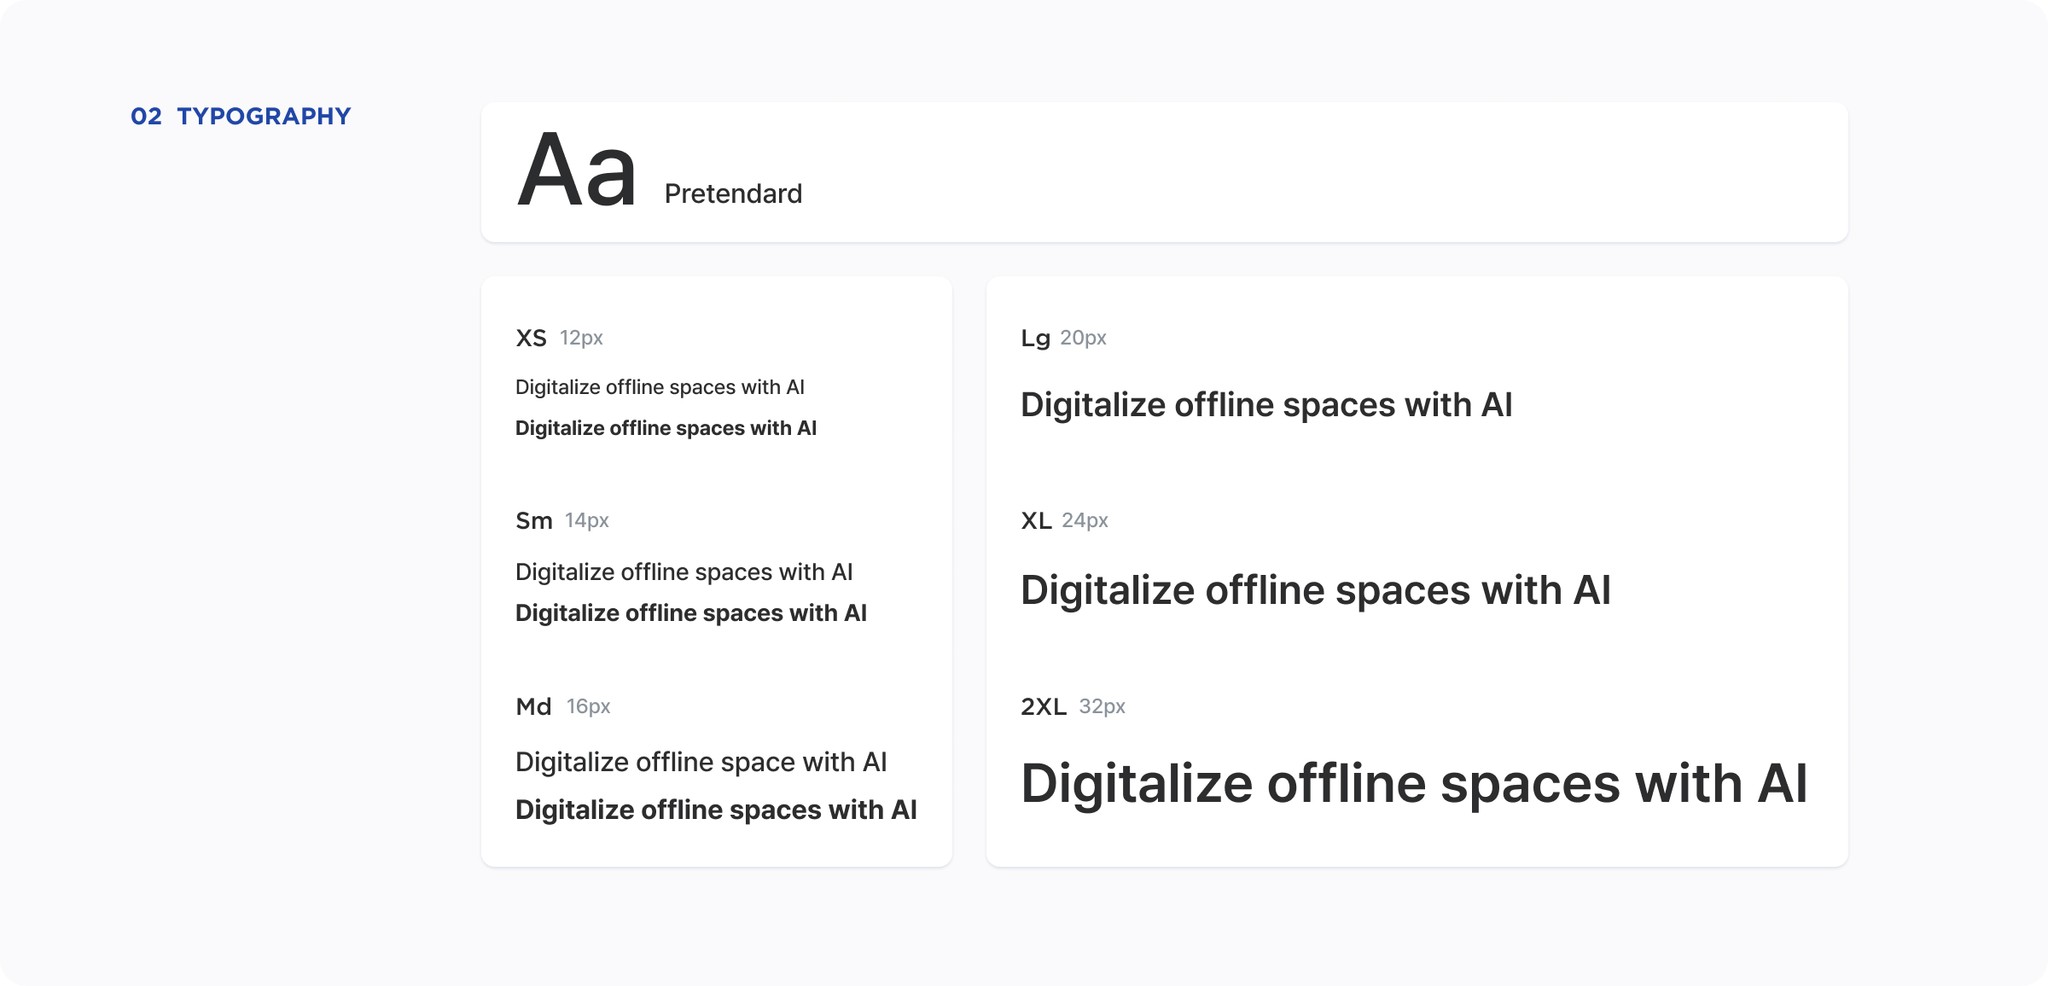
Design System
Our product being in its early stages, it was crucial to continuously and swiftly adapt it to meet customer needs.
To achieve this, we implemented a design system. It allowed us to use elements from the system when creating or altering pages,
significantly accelerating the speed of both design and development.


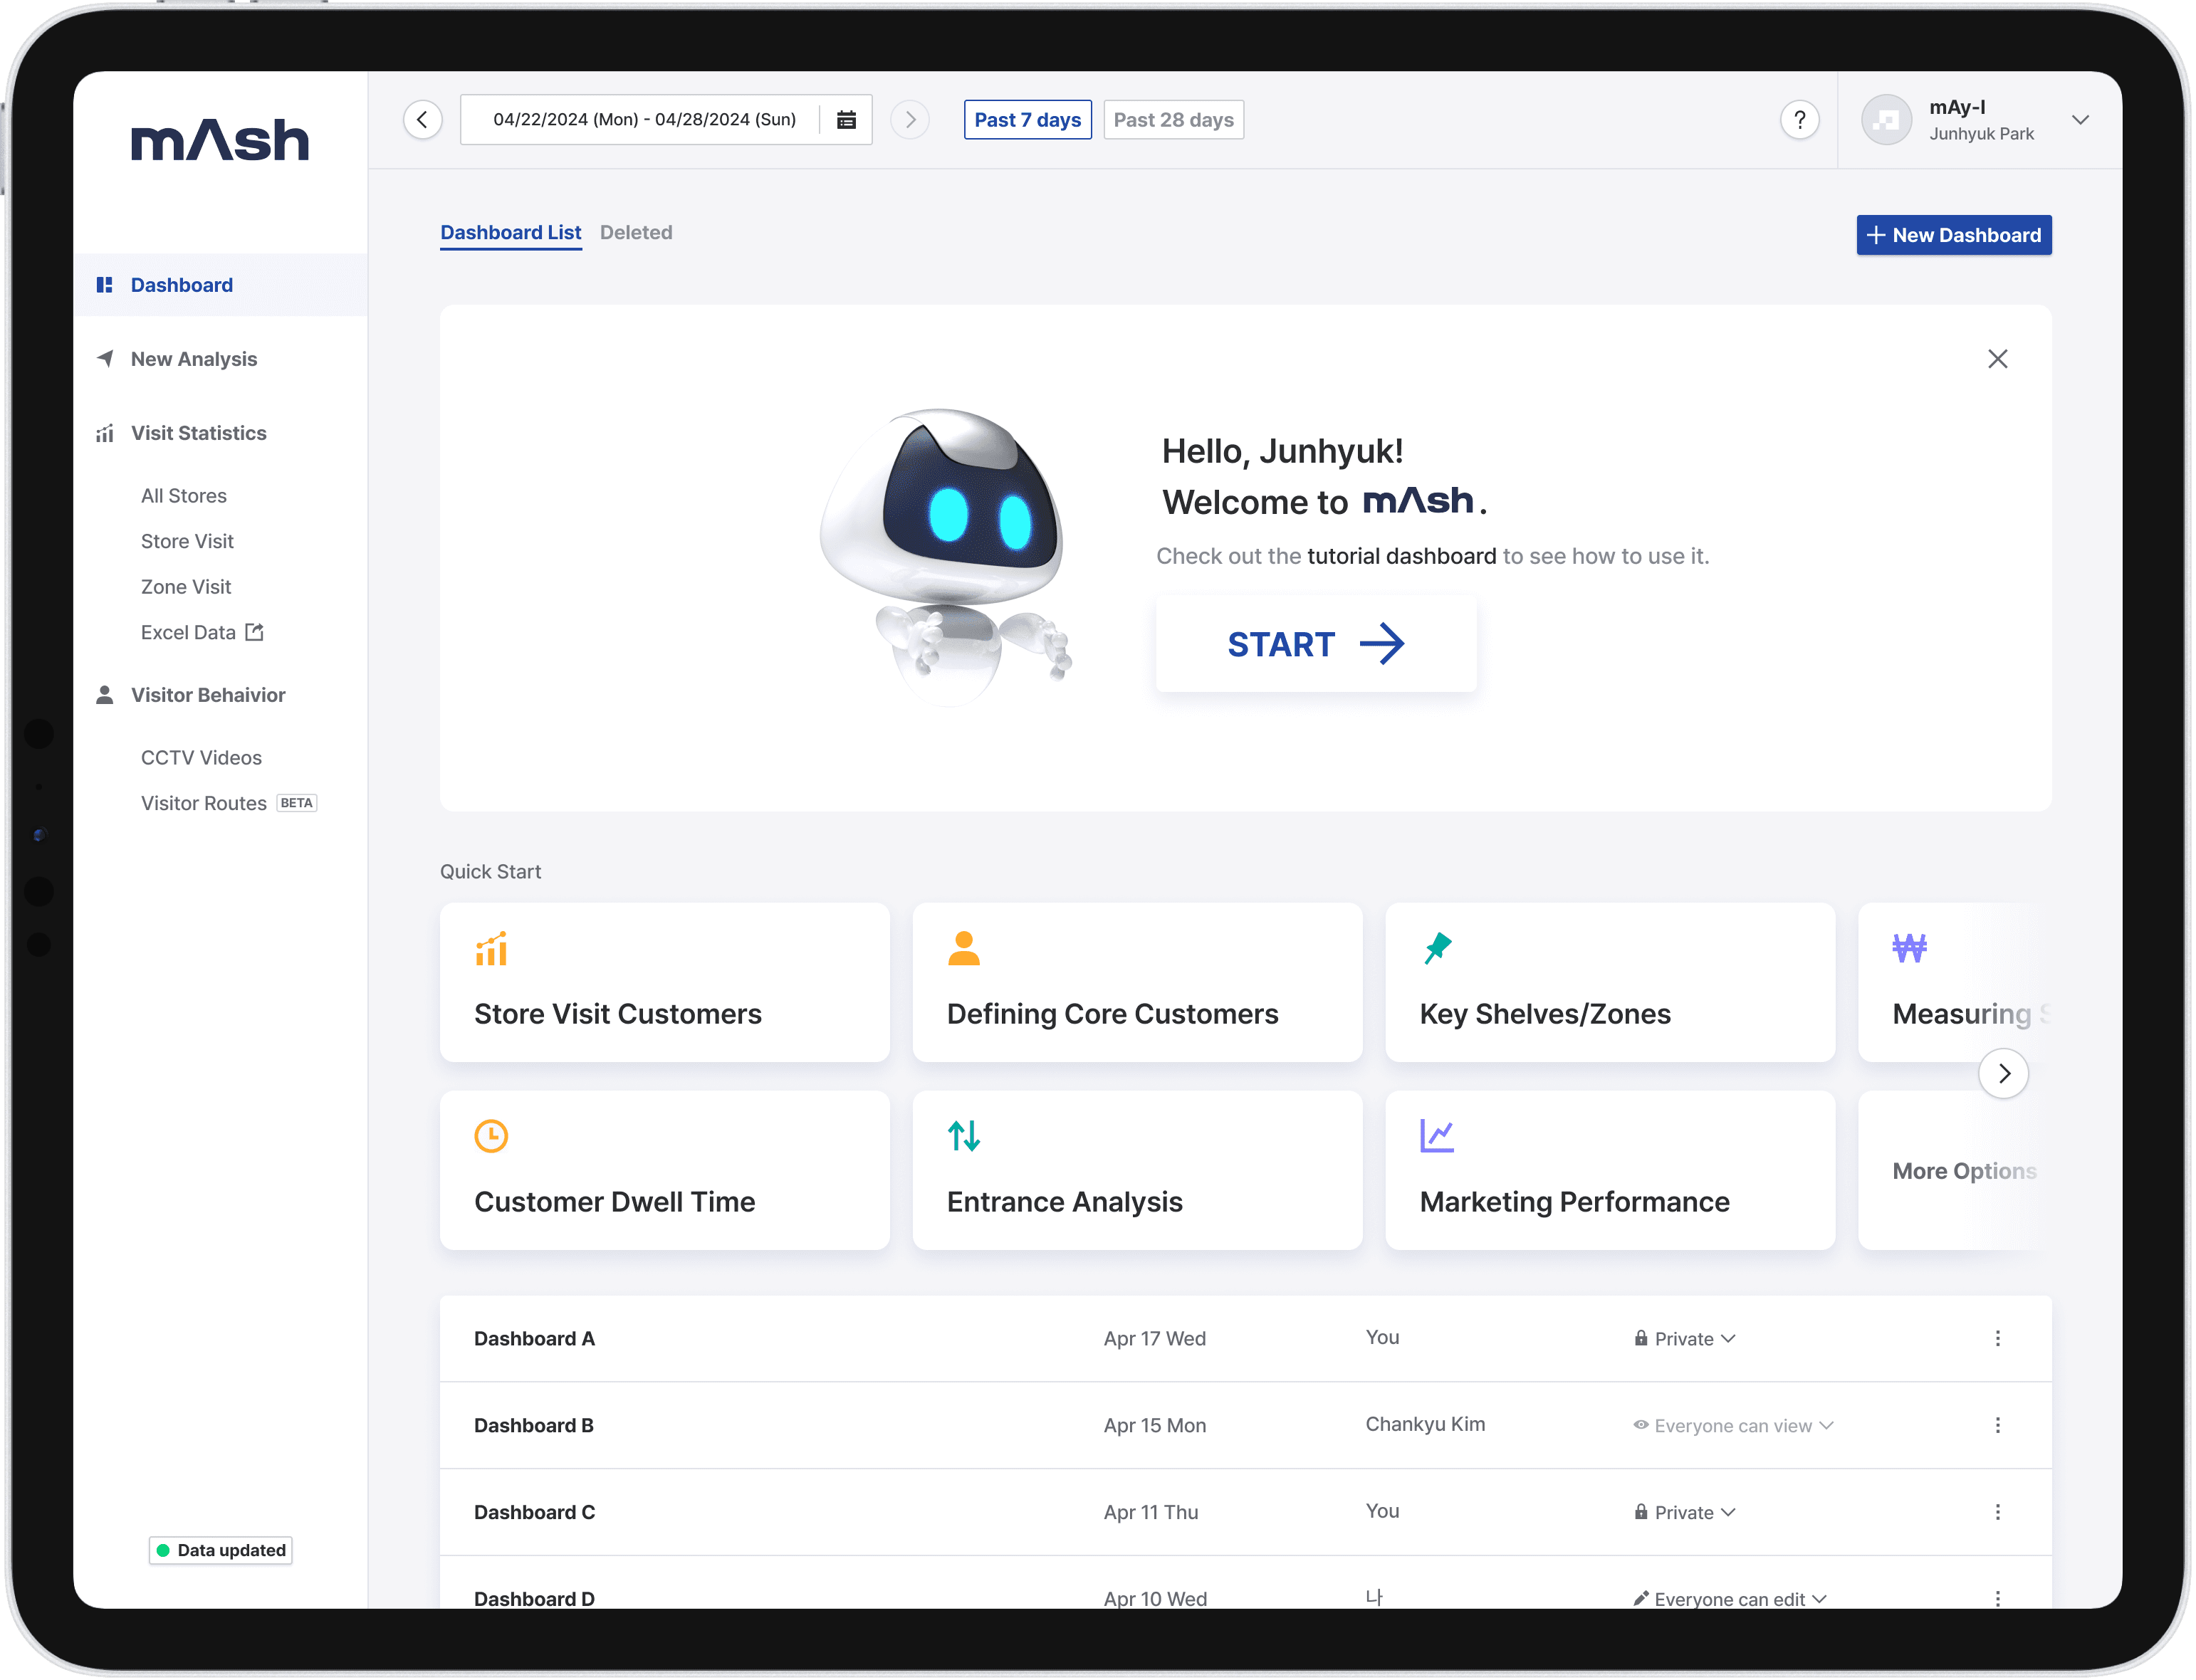
Updated Design
Thanks to systematic user research and a system that allows quick integration,
our product has been able to rapidly evolve to meet the needs of customers.
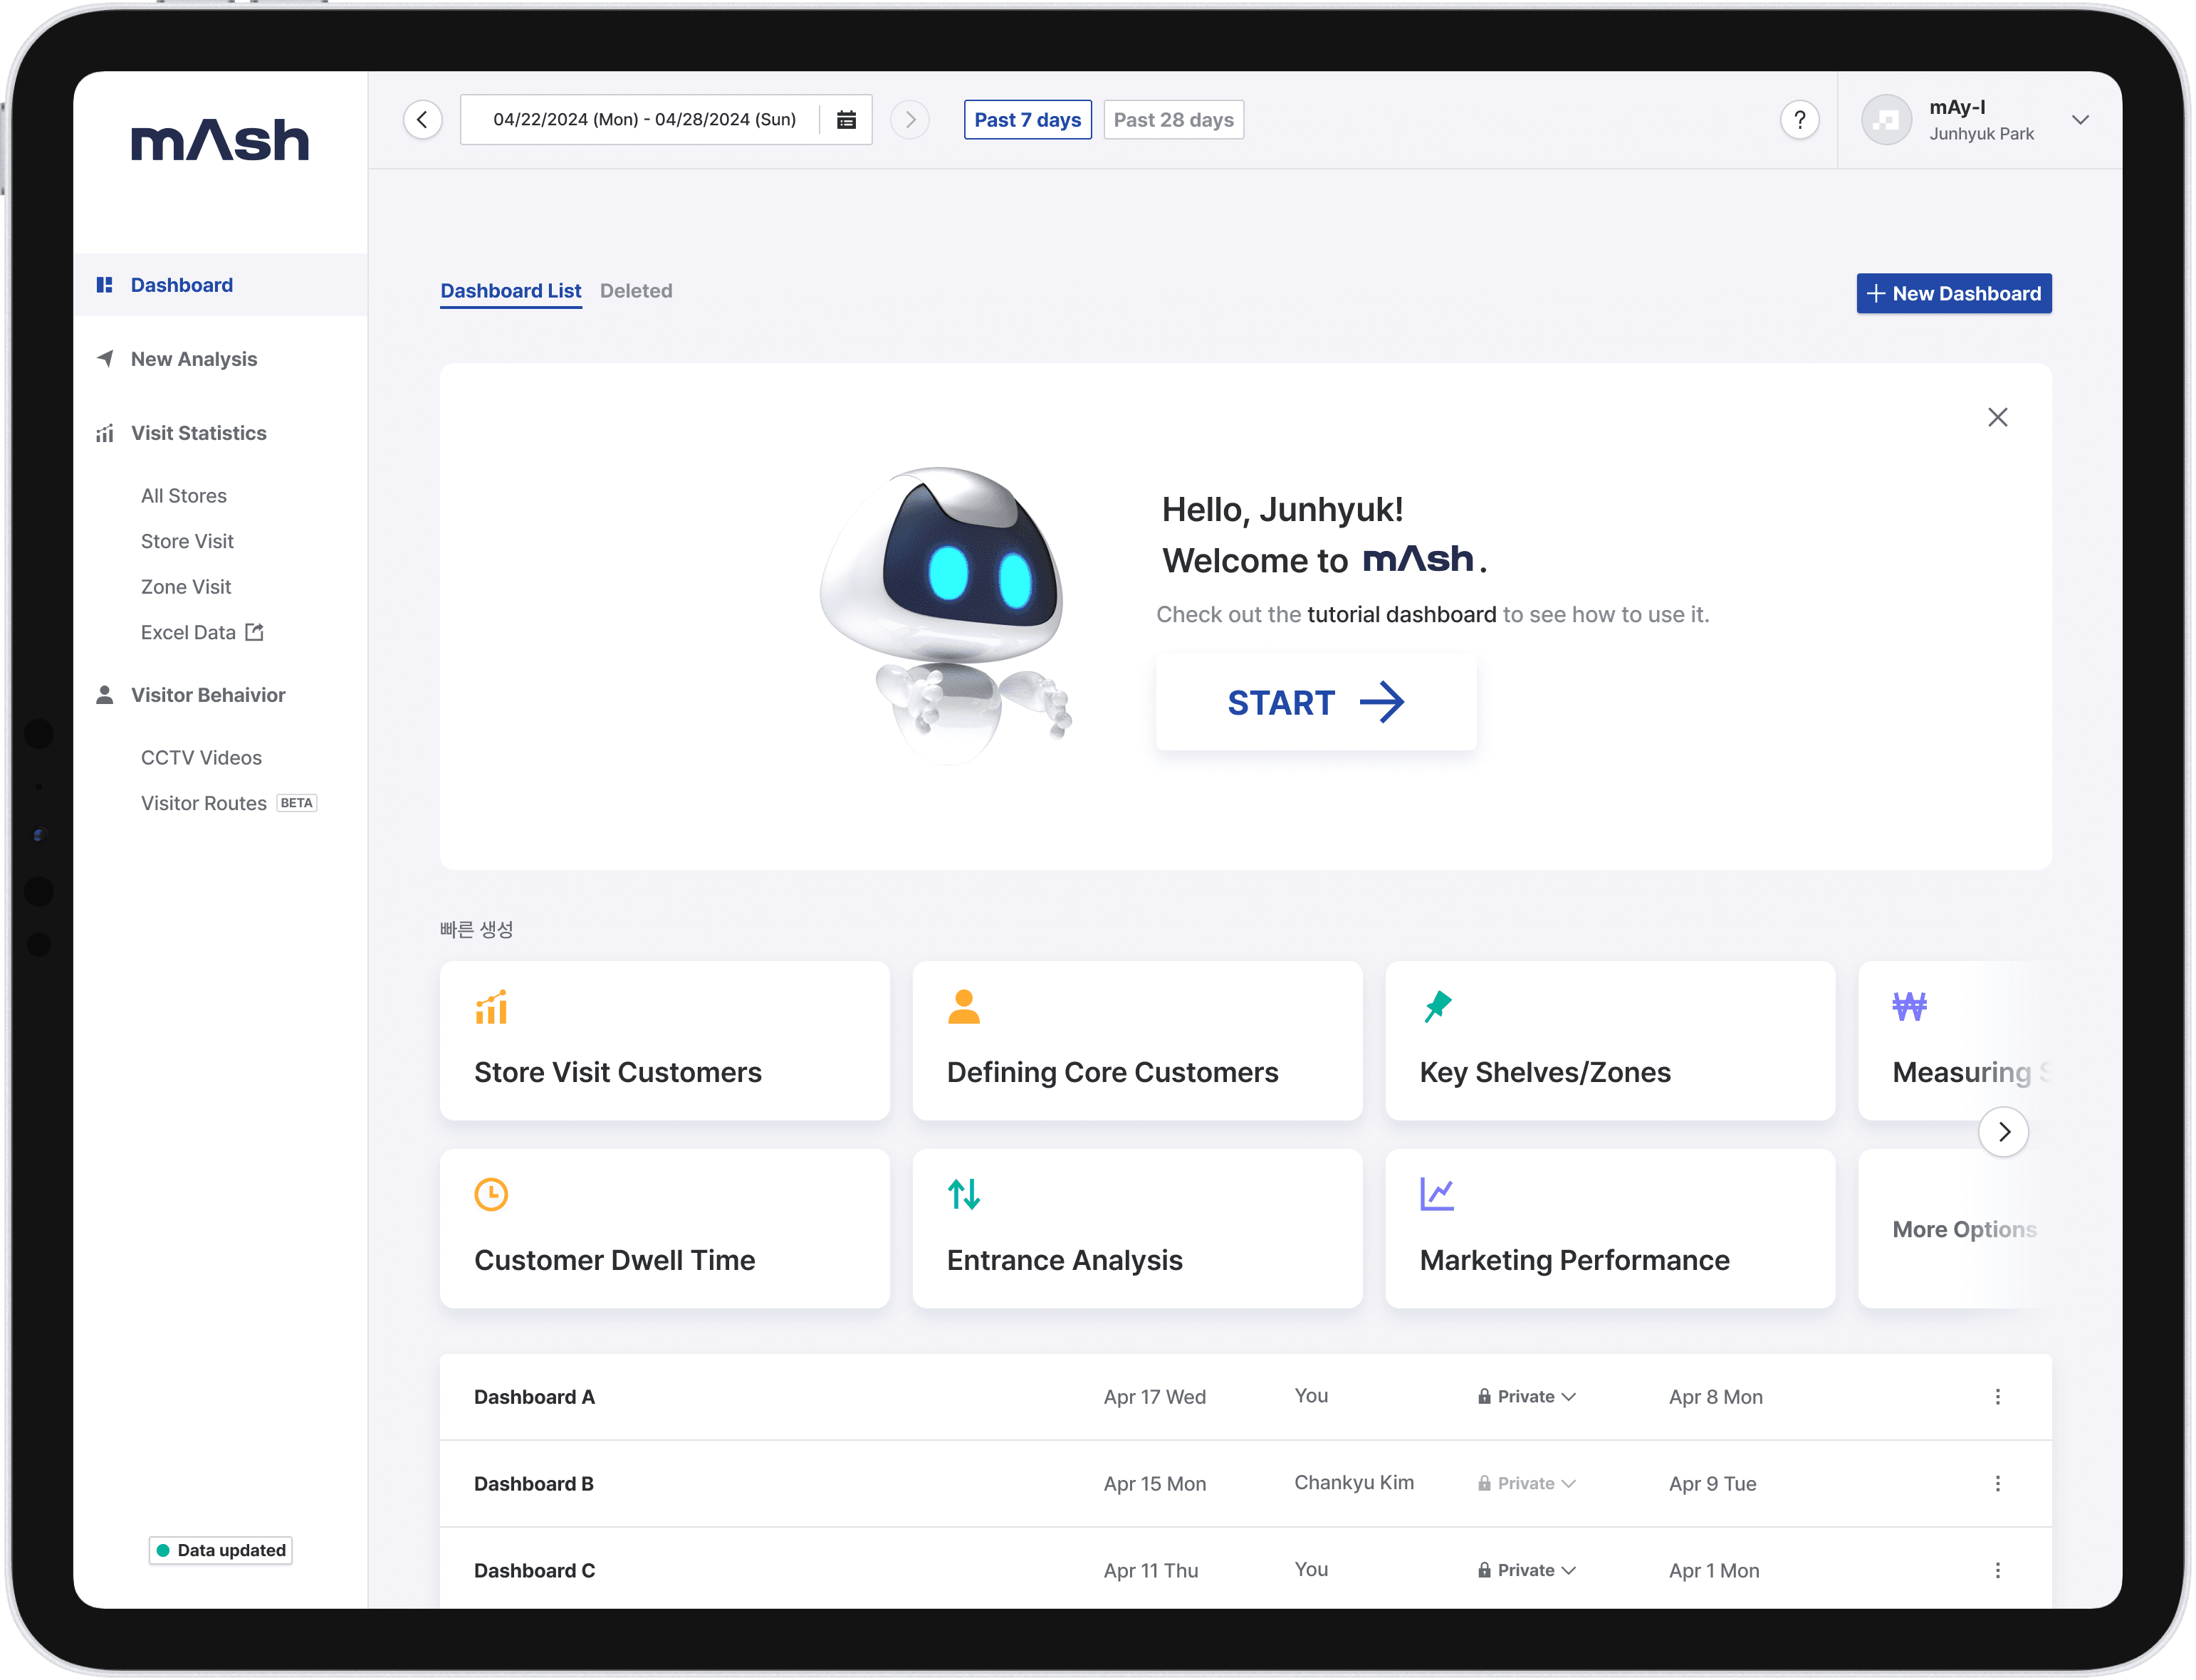
1
Dashboard
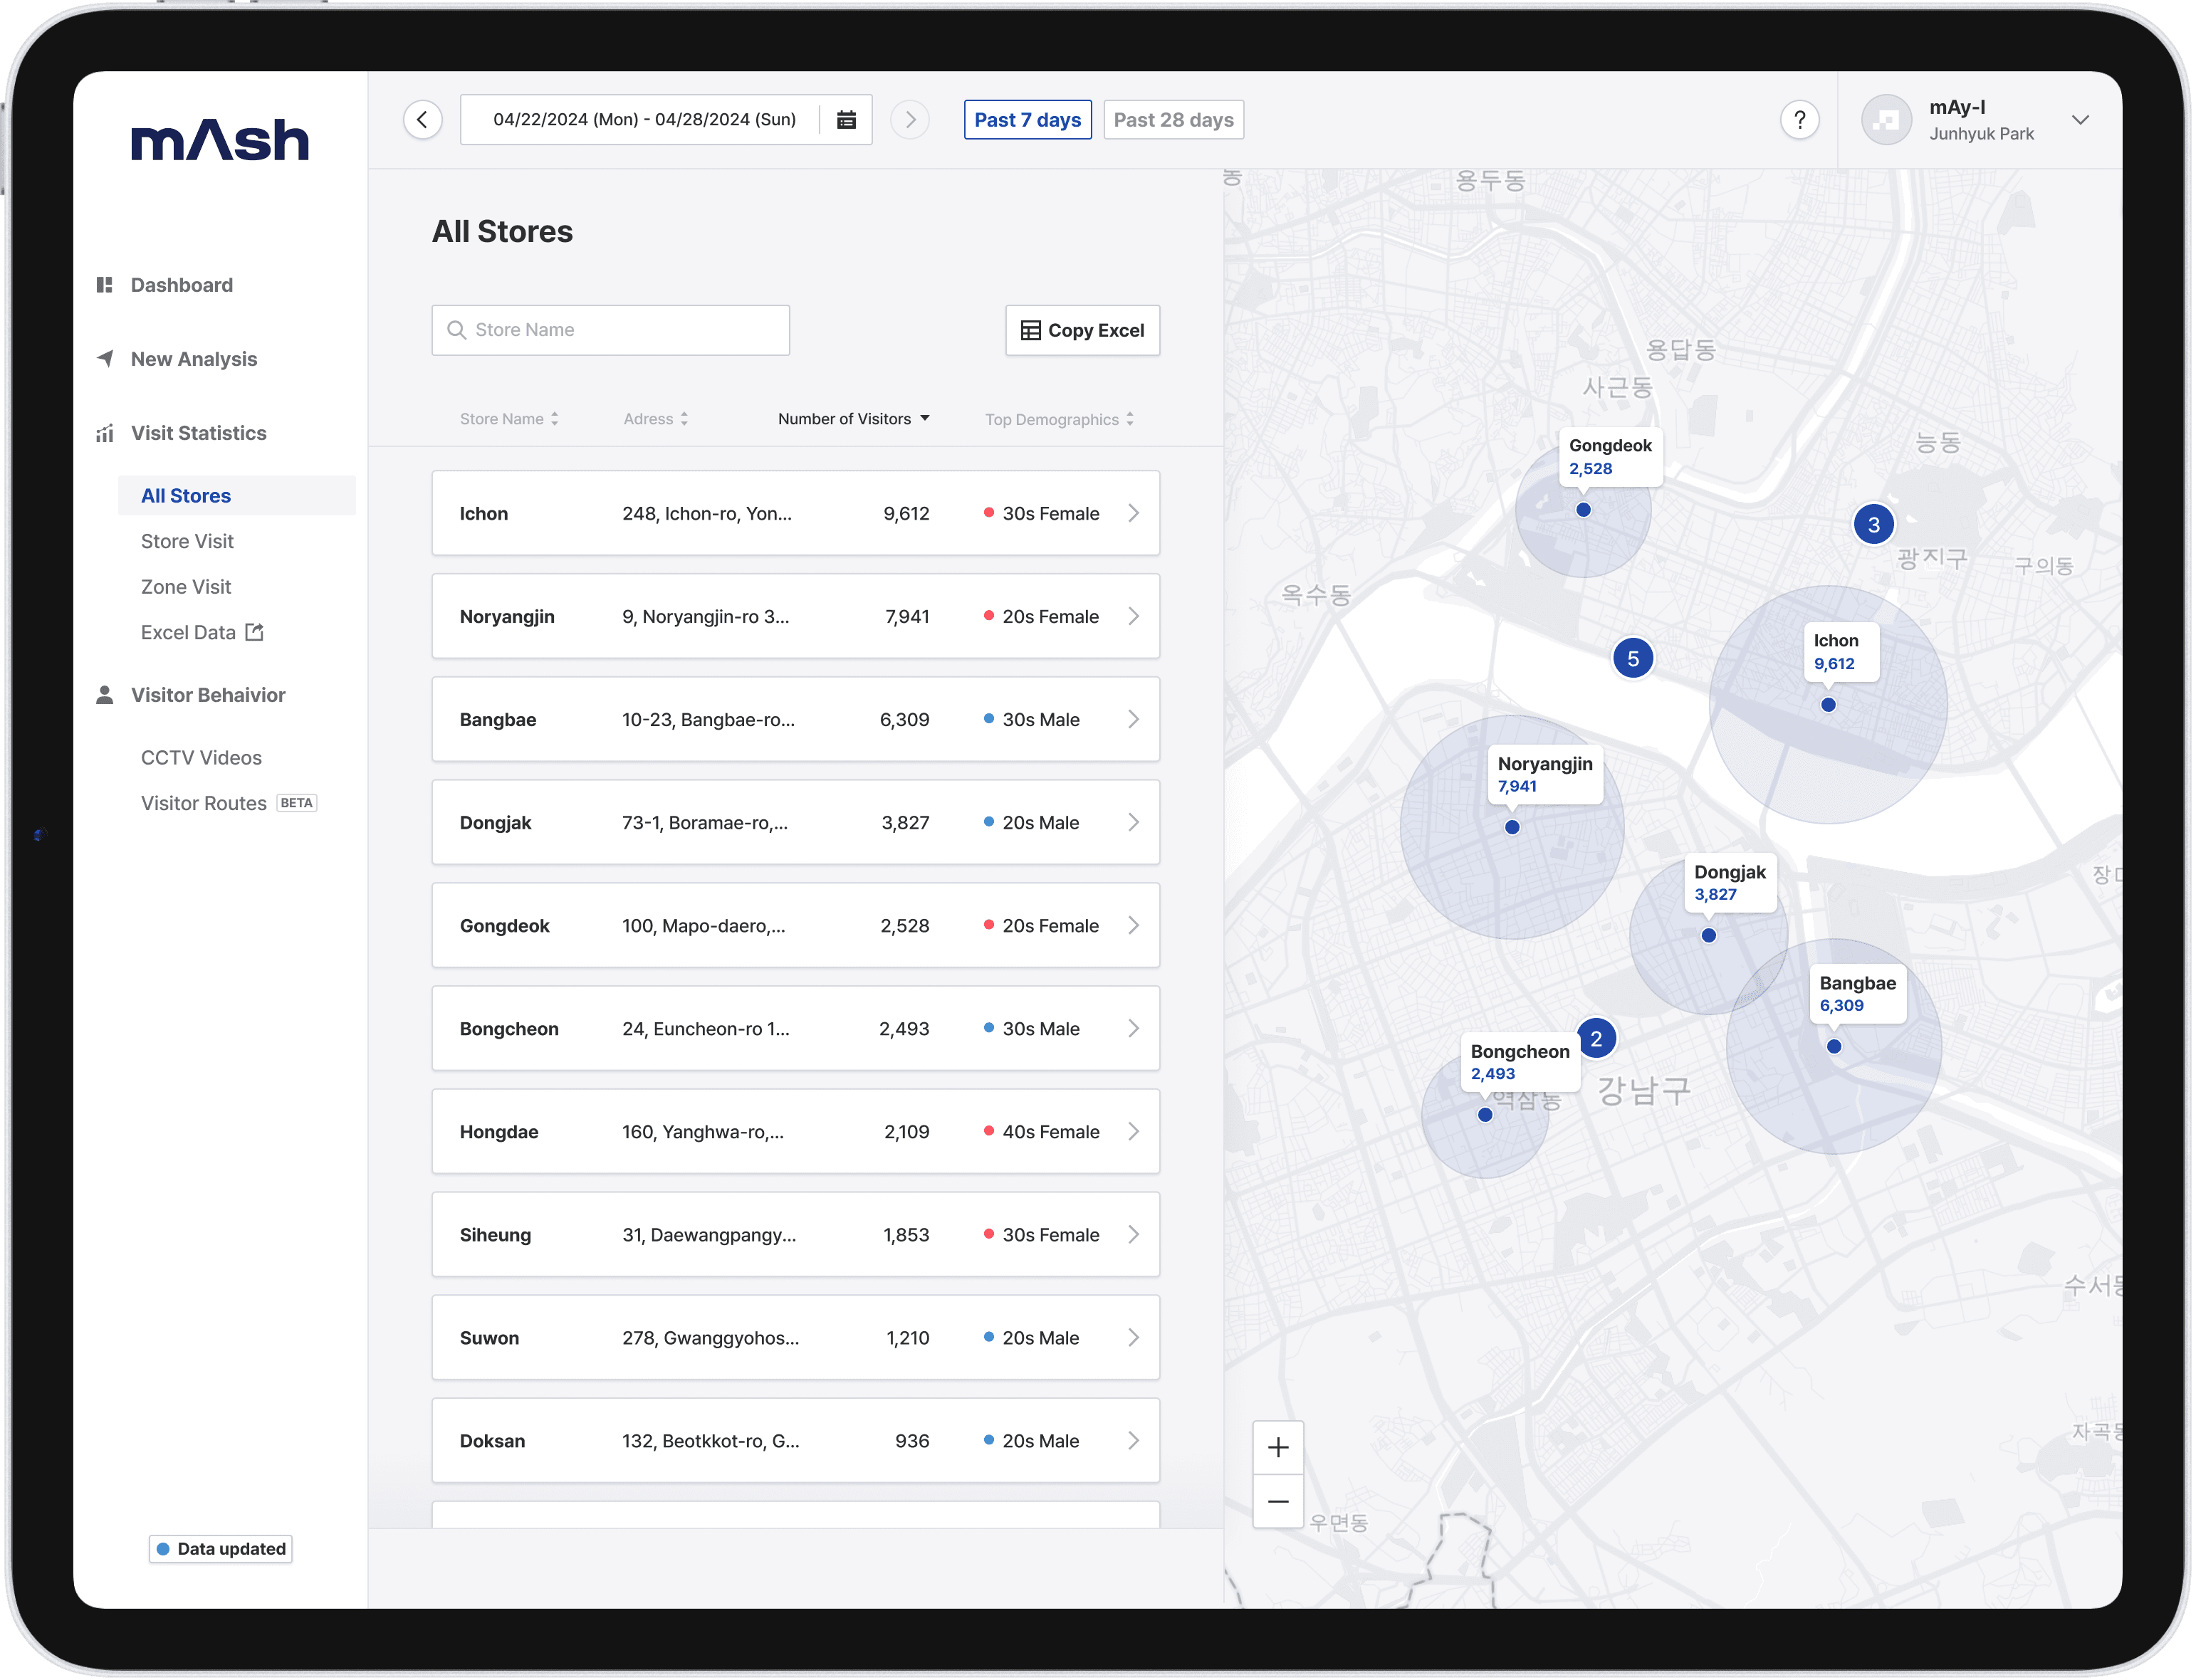
2
All Stores
3
Store Visit

4
Zone Visit

Expansion
Accordingly, the number of our clients, which was very small, has been gradually expanding.


Modularization
As the number of clients increased, their demands gradually diversified and became more complex.
Consequently, instead of dedicating time to individually meet their needs,
we modularized our array of analytical functionalities, allowing clients to configure dashboards to their preferences.


mAsh Start Tool
Addtionally, I also designed a tool for customers and the technical team to set up analysis sections within the store.
Show
Award
CES(Consumer Technology Association) 2024 Innovation Award Product
View Details

More Projects


We should start by discovering the value of offline data.
I believed that the value could not be discovered by us, who were unfamiliar with offline stores.
Then, who could do it instead of us?
The answer was our clients, who possessed domain knowledge of offline markets.
Although users didn't engage much with the dashboard, they often asked us to extract specific data they wanted separately.
So, I created an "Analytics" feature that allowed users to explore various types of data in different formats at their discretion, enabling them to discover the value of offline data themselves.

Another challenge
While users were knowledgeable about offline stores, they had limited understanding of data analysis or the constraints of AI.
As a result, the "Analytics" feature proved too complex for them.
They didn't use the feature and would occasionally access only the basic data we provided.
Make data feel less difficult.
To encourage users to utilize the "Analytics" feature more and discover the value of offline data,
I led a project aimed at enhancing users' understanding of the "Analytics" function.
I recruited participants from a community of working professionals and conducted tests to assess their comprehension through tasks.

The tasks
Previous percentage of the user understanding
Through this process, I realized that the general understanding of the product among typical office workers was as low as 42%.
It shouldn't be surprising that people weren't using or accessing a product they didn't understand.
